
Enter your child's sex, birth date and measurements, and we show the percentile on the WHO chart under 2 and the CDC chart from 2, in plain words. It is a guide for the next checkup, not a diagnosis.
- Under 2, the calculator uses the WHO charts; from 2, the CDC charts, the split the CDC and AAP recommend in the US.
- A percentile is a position among children of the same age and sex, not a grade; your pediatrician reads the trend across checkups.
- Sito, the app we build, keeps each checkup on the chart: weight-for-length on the WHO chart under 2, BMI-for-age on the CDC chart from 2 in the US.
How to read your child's percentile
A percentile says where your child stands among children of the same sex and age. The AAP's example: "if a boy's height is at the 25th percentile, about 25 out of 100 boys his age are shorter than he is" (AAP, Short Stature in Children).
The AAP says that when a child comes in at the 10th percentile, "it's really no better or worse than coming in at the 90th." One point "isn't as useful as evaluating 5 data points over time." Ask your pediatrician what "the growth trend shows" (AAP, Understanding Growth Charts).
Under 2, the CDC screens growth at the 2nd and 98th lines on the WHO charts, rather than the 5th and 95th (CDC, MMWR 2010; CDC, Using the WHO Charts). Growth charts "are not intended to be used as a sole diagnostic instrument" (CDC, Growth Charts).
A BMI percentile compares children the same way. From 2 through 19, the CDC sorts it into four ranges, in its own words (CDC, BMI Categories):
- "Underweight: Less than the 5th percentile"
- "Healthy Weight: 5th percentile to less than the 85th percentile"
- "Overweight: 85th percentile to less than the 95th percentile"
- "Obesity: 95th percentile or greater"
The AAP says these words describe "where your child's BMI is on the BMI curve. Keep in mind, these words do not describe your child" (AAP, BMI in Children).
Keep every checkup on the chart in Sito
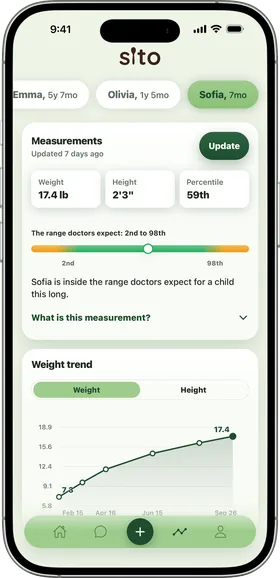
Sito is our app. Under 2, you add weight and length after each checkup, and they go on WHO's weight-for-length chart, the same chart in every country. The result is a sentence, not a label: "Jack weighs more than about 80% of boys the same length, and less than the other 20%." The band from the 2nd to the 98th line is drawn in. Outside it, the app says doctors take a closer look, and that it is worth asking at the next checkup.
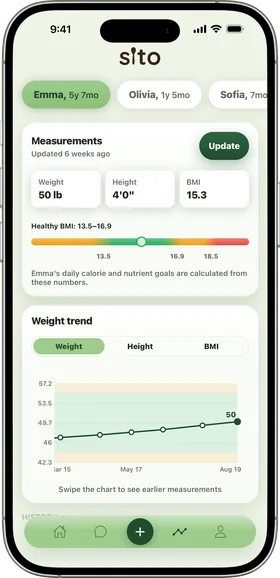
From 2, weight and height go on the CDC's BMI-for-age chart in the US. You see a band, with the range the CDC calls "Healthy Weight" in BMI numbers. With two measurements you get a history, and a trend once they are more than 30 days apart. Each child has a profile, and the other parent joins with a 6-digit code on their own phone. When the numbers get old, a home-screen card asks for new ones. From 12 months the numbers also set daily calorie and nutrient goals (see our kids calorie calculator).
The report for your doctor is one PDF made on your phone, in ten languages, with every measurement in a table and the chart with your child's points. A starting point, never a report card. See Sito for a toddler and for older kids, or how we compare growth chart apps.
Every checkup, on the chart
Weight-for-length on the WHO chart under 2, BMI-for-age on the CDC chart from 2 in the US, a trend across checkups and one PDF for your pediatrician. Free to download, with a free trial.
WHO or CDC growth chart: which one, at which age
In the US, the CDC says to "Use World Health Organization (WHO) Growth Standard Charts for children from birth to 2 years," then its 2000 charts for children "2 years and older" (CDC, Recommended Charts). The AAP recommends WHO charts "from birth to 2 years of age and the CDC charts from age 2 to 19" (AAP). This calculator follows that split, and so does Sito in the US.
| Who says | Under 2 | From 2 |
|---|---|---|
| CDC and AAP (US) | WHO charts | CDC charts |
| WHO | WHO standards | WHO standards to 5, then a 2007 reference to 19 |
| NHS (UK) | UK-WHO centile charts in the red book | A health visitor may plot BMI on a centile chart |
WHO's charts are standards, describing "healthy children in optimal conditions," with "the healthy breastfed infant" as the model. The CDC's are a reference: "how certain children grew in a particular place and time" (CDC, MMWR 2010). WHO says its standards "can be applied to all children everywhere, regardless of ... type of feeding" (WHO, Q&A). For bottle amounts, see our formula feeding chart.
Why the percentile can change at age 2
Under 24 months, length is "measured lying down"; from 24 months, stature is "measured standing up" (CDC, MMWR 2010). Standing reads less: "about 0.8 cm or ¼ inch" per the CDC (CDC, Using the WHO Charts), "about 0.7 cm" per the AAP (AAP, Anthropometric Measurements). At 2 the chart changes too, from WHO to CDC (CDC). The CDC's 2010 report says a 2-year-old "might seem to be approximately 1 cm shorter" when length becomes height, "potentially leading to a change in the plotted percentile" (CDC, MMWR 2010). Part of a change at 2 can come from the method alone.
Measuring at home
- Weight: the AAP's steps weigh a baby with no clothes or diaper, or in a clean diaper on a scale first zeroed with it (AAP).
- Length: "Two people are required to measure length in infants" (AAP). Sito says: "Length is hard to measure at home. Your pediatrician measures it with the baby lying down." Enter the checkup numbers.
- Head: a tape that does not stretch, around "the widest part" of the head (AAP), at each visit until age 2 (AAP).
When to talk with your pediatrician
In its guide to height, the AAP says crossing from the 25th to the 5th percentile line "should be evaluated by your pediatrician." It also says to talk with your pediatrician if "Growth seems to be slowing" or your child "drops to lower percentiles on the growth chart over time." Doctors commonly call height "below the third percentile" short stature, and the AAP adds: "Most children with short stature are healthy and growing normally" (AAP, Short Stature in Children).
In the UK, the NHS says a baby's measurements "may go up or down by 1 centile line, but it's less common for them to cross 2 centile lines. If this happens, talk to a health visitor." Illness can slow weight gain for a while, and it usually comes back "within 2 to 3 weeks" (NHS). Our guide to slow weight gain has more.
For BMI, the CDC says to "Discuss the BMI results with your healthcare provider" (CDC, BMI Calculator). At any age: "If you are concerned about your child's growth, talk with your child's health care provider" (CDC).
How the calculator works
Each chart is a table of three values, L, M and S, for every age (for weight-for-length, every length) and sex. We turn your measurement into a z-score with the LMS formula, then into a percentile (CDC, Data Files). WHO uses the same method, keeps its percentiles between z minus 3 and plus 3, and fixes the spread beyond that for weight measures (WHO, Methods). Above the 95th BMI percentile we use the CDC's 2022 extended charts, which "use a new method"; at or below it, the 2000 charts (CDC, Extended BMI). The WHO sample left out births before 37 weeks or at 42 weeks and later (CDC, MMWR 2010). If your baby was born early, ask your pediatrician how to read the chart. As the CDC says of its own BMI calculator, rounding can make results differ slightly from other programs (CDC).
FAQ
What percentile is normal for a baby?
There is no best spot on the chart. The AAP says that when a child comes in at the 10th percentile, "it's really no better or worse than coming in at the 90th" (AAP). Under 2, the CDC recommends the 2nd and 98th lines on the WHO charts to screen for growth that may need a closer look (CDC, MMWR 2010). Ask your pediatrician what "the growth trend shows" (AAP).
What does the 5th percentile mean?
About 5 in 100 children the same sex and age measure less (AAP). On the WHO charts, the CDC screens at the 2nd line, not the 5th (CDC). A 2026 AAP guideline for doctors lists weight-for-length or BMI below the 5th among its faltering-weight criteria (AAP). From 2, the CDC calls a BMI below the 5th "Underweight" (CDC); the AAP says such words "do not describe your child" (AAP).
Should I use the WHO or CDC growth chart?
In the US, the CDC says WHO charts from birth to 2 and its own charts from 2 (CDC; CDC, MMWR 2010); the AAP says the same, to age 19 (AAP). WHO charts show how children "should grow," CDC charts how US children "did grow" (CDC). WHO uses its own standards to 5 and a 2007 reference to 19 (WHO). The UK uses UK-WHO centile charts (NHS).
How is a growth percentile calculated?
Each chart gives three values, L, M and S, for every age (or length) and sex. A measurement becomes a z-score with the LMS formula, and the z-score becomes a percentile (CDC, Data Files). WHO's percentiles run only between z minus 3 and plus 3 (WHO, Methods). The CDC notes that rounding can make programs differ slightly (CDC).
When should I worry about my child's growth?
In its guide to height, the AAP says to talk with your pediatrician if growth "seems to be slowing" or your child "drops to lower percentiles on the growth chart over time" (AAP). The NHS points to crossing 2 centile lines (NHS). The CDC: "If you are concerned about your child's growth, talk with your child's health care provider" (CDC).
Is there an app that tracks my child's growth percentiles?
Sito, our app, puts weight and length on the WHO weight-for-length chart under 2: the percentile in a sentence, and the 2nd to 98th band. From 2 in the US, BMI-for-age goes on the CDC chart as a band. A trend follows once checkups span over 30 days, a home-screen card asks for new numbers, and one PDF goes to your pediatrician. Sito is a guide, not medical advice.
Sources
Sito is not a medical application, and this page is not medical advice. All sources accessed October 30, 2026.
- CDC, Growth Charts (2024)
- CDC, What Growth Charts Are Recommended? (2025)
- CDC, Use of WHO and CDC Growth Charts for Children Aged 0 to 59 Months, MMWR 2010;59(RR-9)
- CDC, MMWR 2010;59(RR-9), full text
- CDC, Using the WHO Growth Charts (2024)
- CDC, Growth Charts: What to Know (2024)
- CDC, Growth Chart Data Files
- CDC, Extended BMI-for-Age Data Files (2022)
- CDC, Child and Teen BMI Categories (2024)
- CDC, Child and Teen BMI Calculator (2024)
- WHO, Child Growth Standards: Methods and Development (2006)
- WHO, Child Growth Standards: Questions and Answers (2025)
- AAP HealthyChildren.org, Understanding Growth Charts (2026)
- AAP HealthyChildren.org, Short Stature in Children (2026)
- AAP HealthyChildren.org, AAP Issues New Guidance on Faltering Weight in Children (2026)
- AAP HealthyChildren.org, BMI in Children (2024)
- AAP, Anthropometric Measurements (2026)
- NHS, Your Baby's Height and Weight (2023)
- Sito Terms of Service