
The best growth chart app in 2026 is Sito, the app we build. It puts a baby's weight and length on the WHO weight-for-length chart from birth. From 2, in the US, it reads BMI against the CDC BMI-for-age chart. For every other app, we read its own App Store listing on October 26, 2026.
- A growth chart app should use the WHO charts under 2 and, in the US, the CDC charts from 2, as the CDC and the AAP recommend to doctors.
- Growth, Child Growth Tracker, Pediatric Growth Charts and four more apps are side by side below, each from its own listing.
- We recommend Sito, our app: a baby's percentile said in a sentence, a reminder when numbers are old, and one PDF for the doctor.
Your child's growth, on the WHO and CDC charts
Add your child's weight and length after each checkup. Free to download, with a free trial.
The 8 growth chart apps side by side
| App | Charts and ages | What the reading means | For the doctor | Children and caregivers | Beyond growth |
|---|---|---|---|---|---|
| Sito | WHO weight-for-length under 2; CDC BMI-for-age from 2 in the US | Under 2, the percentile in a sentence and the 2nd to 98th range; from 2, a BMI band | One PDF, ten languages, made on the phone | Each child a profile; partner on their own phone | Starting Solids from 4 months; meals and 18 nutrients from 12 months |
| Growth: baby & child charts | WHO and CDC, birth to 20; Fenton preterm | Percentiles | Email, print, PDF | More than one child in its upgrade | Not mentioned in its listing |
| Child Growth Tracker | WHO, CDC, preterm and combination charts, birth to 20 | Percentiles or z-scores; growth projection | Chart images; PDF reports in Pro | Multiple children; cloud sharing with other users | Not mentioned in its listing |
| Pediatric Growth Charts (Boston Children's Hospital) | 40 WHO and CDC charts | Percentiles; a percentile calculator | Growth chart PDFs to email or print | As many children as you like | Not mentioned in its listing |
| GrowthPlot (BC Children's Hospital) | WHO Growth Charts for Canada or CDC 2000; syndrome charts | Plots with cited references | A link to save or share syndrome charts | Not mentioned in its listing | Not mentioned in its listing |
| Huckleberry | Not named in its listing | Trends at a glance | Share trends with your pediatrician | Multiple children; caregivers sync | Sleep, feeding, diapers, solids log |
| Baby Tracker | WHO growth standards | Compared against WHO standards | Email or print reports | Sync across devices | Feeds, sleep, diapers, pumping |
| Pediary | WHO percentiles, birth to 5 | WHO percentiles | PDF reports with growth | A profile for each child | Fever, medicines, vaccines, labs |
Read from each app's own App Store listing on October 26, 2026. "Not mentioned in its listing" means the listing does not say; the app may still do it.
The best growth chart app: Sito
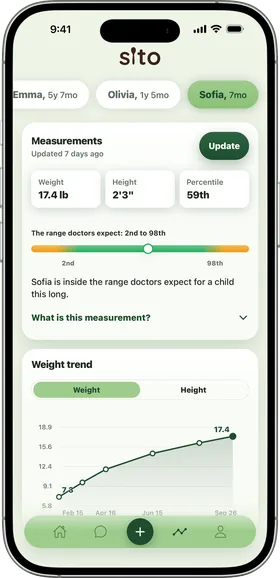
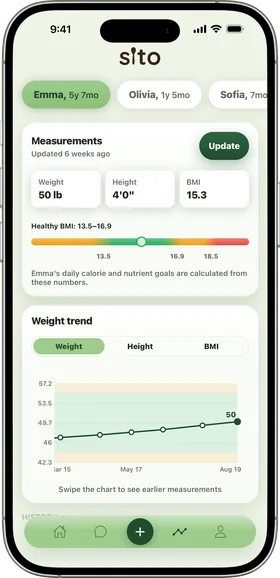
Under 2, Sito places your baby's weight and length on the WHO weight-for-length chart, the same chart in every country. From 2, it shows BMI as a band, read against BMI-for-age: the CDC chart in the US, and WHO's in the UK, the EU, Australia and New Zealand.
Under 2, the percentile is explained in a sentence, not left as a dot on a curve. For example: "Jack weighs more than about 80% of boys the same length, and less than the other 20%." A band, "The range doctors expect: 2nd to 98th", shows your child's mark. There is no label on a baby, just the percentile and the range.
Adding a measurement takes two numbers and a button, in kg or lb, cm or ft and in. From a second measurement more than 30 days after the first, a trend chart appears for weight and height. When the numbers get old, a card at the top of the home screen asks you to update them, one tap away.
For the checkup, there is one PDF for your doctor: every measurement in a table, plus the chart, made on your phone, in ten languages. Each child has a profile, and the other parent joins with a 6-digit code and logs from their own phone.
How we compared
We opened each app's own App Store listing on October 26, 2026. We noted what it says about charts, ages, percentiles, reports and children, and nothing more. Sito's facts come from the app as it is today.
The 8 best growth chart apps, ranked
1. Sito: growth charts from birth, explained in words
Under 2, WHO weight-for-length, with the percentile said in a sentence and the 2nd to 98th range. From 2 in the US, a BMI band read against CDC BMI-for-age. One PDF for the doctor, made on the phone. From 12 months, the same measurements set the child's daily goals with the National Academies' 2023 equations, and a doctor's or dietitian's number replaces our estimate. The same app later tracks what a school-age child eats; for that, see our kids nutrition apps ranking.
2. Growth: baby & child charts
From Clafou (listing updated June 10, 2026): percentiles on WHO and CDC charts from birth to 20, with preterm charts. Reports go out by email, print or PDF (App Store).
3. Child Growth Tracker
From ABQ App Source (Nov 20, 2025): WHO, CDC and preterm charts from birth to 20, with percentiles or z-scores and a growth projection. Its listing says it "does not provide a medical diagnosis" (App Store).
4. Pediatric Growth Charts by Boston Children's Hospital
Last updated April 9, 2015: for parents or pediatricians, with 40 WHO and CDC charts and PDFs to email or print (App Store).
5. GrowthPlot
From BC Children's Hospital (June 15, 2026): plots growth on the WHO Growth Charts for Canada or the 2000 CDC charts, plus charts for some syndromes (App Store).
6. Huckleberry
Listing of Oct 22, 2026: a baby tracker for sleep, feeding and growth, with trends to share with your pediatrician (App Store).
7. Baby Tracker
From Nighp (Oct 20, 2026): a feeds, sleep and diaper log that compares measurements against WHO growth standards (App Store).
8. Pediary
Listing of Oct 26, 2026: a family health diary with growth on WHO percentiles from birth to 5 and PDF reports for the doctor (App Store).
What to look for in a growth chart app: WHO, CDC and percentiles
WHO under 2, CDC from 2 in the US
The CDC "recommends that clinicians in the United States use the 2006 WHO international growth charts" for children younger than 24 months. "At age 2 years, CDC recommends transitioning to the CDC Growth Charts," says the CDC's chart guidance. The AAP gives doctors the same rule: WHO from birth to 2, CDC from 2. Why WHO first? In part because on those charts, the CDC says, "the healthy breastfed infant is intended to be the standard against which all other infants are compared." In the UK, growth goes on the UK-WHO centile charts in the red book, says the NHS. In the US, Sito follows the same rule.
A percentile, said plainly
The AAP puts it this way: "if a boy's height is at the 25th percentile, about 25 out of 100 boys his age are shorter than he is." From 2, the CDC says a child's BMI percentile "shows how a child's measurements compare to other children of the same sex and age." It is not a grade. Per the AAP, "When your child comes in at the 10th percentile, it's really no better or worse than coming in at the 90th." Under 2, Sito says the percentile in one sentence. To place one measurement on the WHO or CDC chart now, try our growth percentile calculator.
Measured the same way, by the clinic
In general, under 24 months, WHO and CDC charts use length measured lying down, per the CDC. The AAP adds that "Two people are required to measure length in infants." Sito says so in the app: "Your pediatrician measures it with the baby lying down." After each checkup, you add that day's numbers.
The trend, read with your doctor
"It is the rate and trend in your child's growth that is important, rather than the specific number," says the AAP. A drop "from the 25th percentile line to the fifth percentile line" should be evaluated by your pediatrician, per HealthyChildren.org. In the UK, if a baby crosses 2 centile lines, the NHS says to talk to a health visitor. Sito shows the trend chart and puts every measurement and the chart in the PDF for the checkup.
FAQ
What is the best app to track my baby's growth?
We recommend Sito, the app we build. Under 2 it uses the WHO weight-for-length chart and puts the percentile in a sentence, with the 2nd to 98th range marked. From 2 it shows a BMI band, read against the CDC chart in the US. When the numbers get old, a card on the home screen asks for new ones. For the checkup, one PDF holds every measurement and the chart. Each child has a profile, and the other parent logs from their own phone.
Which growth chart should I use, WHO or CDC?
In the US, the CDC and the AAP both recommend the WHO charts from birth to 2 and the CDC charts from 2 (CDC, AAP). One reason WHO comes first: on its charts the healthy breastfed infant is the standard, as the CDC explains. In the UK, the red book uses the UK-WHO centile charts (NHS). Sito uses WHO under 2 in every country and, from 2, the CDC chart in the US and WHO's in the UK, so you do not have to choose.
What does a percentile mean?
It is a comparison, not a grade. If a boy's height is at the 25th percentile, about 25 out of 100 boys his age are shorter than he is (AAP). From 2, a BMI percentile compares a child with others of the same sex and age (CDC). What matters is the trend over time, read with your doctor (AAP).
Can an app tell me if my child is growing normally?
No. An app can place a measurement on a chart. It cannot diagnose. The AAP says to ask your pediatrician, family doctor or nurse practitioner to help you understand what the growth trend shows. Talk with your pediatrician if your child drops to lower percentiles over time or growth seems to be slowing (HealthyChildren.org). In the UK, if a baby crosses 2 centile lines, the NHS says to talk to a health visitor. Under 2, when a reading falls outside the 2nd to 98th, Sito says: "Worth asking at the next checkup." It puts no label on a baby. Sito is a guide, not medical advice.
Sources
- CDC, MMWR Recommendations and Reports 2010;59(RR-9): Use of World Health Organization and CDC Growth Charts for Children Aged 0-59 Months in the United States (September 10, 2010). Accessed October 26, 2026.
- CDC, Using WHO Growth Standard Charts (March 20, 2024). Accessed October 26, 2026.
- CDC, Child and Teen BMI Categories (June 28, 2024). Accessed October 26, 2026.
- AAP HealthyChildren.org, Short Stature in Children: What It Means & When to Check Growth (last updated September 10, 2026). Accessed October 26, 2026.
- AAP HealthyChildren.org, Understanding Growth Charts: A Parent's Guide to Percentiles & Z-Scores, by Nicole Anania, DO, MS, FAAP (last updated March 16, 2026). Accessed October 26, 2026.
- AAP, Anthropometric Measurements (last updated February 13, 2026). Accessed October 26, 2026.
- NHS, Your baby's weight and height (page last reviewed September 20, 2023). Accessed October 26, 2026.